How I Predict SF Weather to the Minute
You don’t have to be highly trained to predict whether it will rain in the next hour right where you are. Or where the fog will go.
There are five sites I use. The first (“Hourly”) is unreliable since it doesn’t tell where or how much rain. It lets you know what the “experts” think is happening in your region. To fully understand my method, read the whole post. I’ve placed the links at the top so you can bookmark this page and use it as your crystal ball.
Chance-O-Rain Season |
Blasting Fog Season |
 “Hourly” |
 Radar |
 Clouds |
 Pacific |
 Winds |
 Fog |
The first four are useful in chance-o-rain season, and Winds and Fog are good for fogging season. To practice, check each time you head out the door or make an outdoor plan for within 36 hours.
Impatience note: Animated loops, which most of these are, require slightly more loading time than some simpler web sites, so be patient. If it doesn’t even start to load after a full 20 seconds, reload the page.
Chance-O-Rain Season
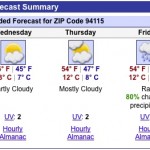 Hourly: Use this site skeptically to check for rain that is expected by the experts in the next 4 – 48 hours (outside that, it gets very unreliable). It has an “hourly” tab and others. It’s a good place to start for a rough sense. On my settings for the site, I ask for both Fahrenheit and Celsius. I used my zip code to get the local info, but you can use your own.
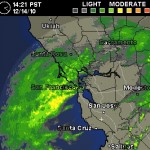 Dopplar Radar: Check for rain in the next 5 – 120 minutes (almost down to the minute if you measure storm movement carefully). The loop has images of the past 45 minutes of precipitation, ending a few minutes ago. You can choose to only view the latest image or even to see regional radar which will show a little farther out to sea. With the clock in the upper left, you can see how fast the color patches are moving toward SF, and measure out how long it will take for each part of the storm to arrive. It’s not always simple: sometimes storms build or dissipate, rather than simply moving in, so you have to get used to looking for those subtleties. Gray means drizzle, but sometimes the radar can’t detect very light drizzle. In this example image, the rain was just beginning to hit SF as a Thinkwalk ended. Seeing, in advance, a gap in the rains that approached allowed us to hold an event precisely between two storms, rather than cancel due to an 80% rain prediction. And it was a wonderful Thinkwalk!
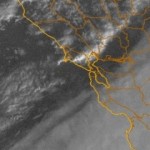 Visible clouds: Since a clear patch on the radar may be drizzle, one way to tell is to find out if it’s cloudy (works only in the daylight). This cloud animation is most useful when the rain is in small patches with sunny skies between. That often happens in SF from November to March. In the picture to the left, there’s a field of drizzly rain to the southeast and isolated storms to the northwest with an band of fairly open sky over SF. The loop shows 1:45 (105 minutes), in 15-minute increments, ending within the past half hour. The clock is at the top of the image, centered.
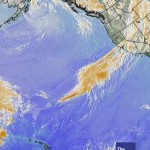 Pacific: Since the radar site noted above can’t show much distance out into the Pacific Ocean, you can use various satellites that do. Cloud temperature is the one I find most useful. High clouds are colder, showing up as reds and blues on this site. High clouds most likely to be big storms. Use this to get an idea of what’s coming in the next 4 – 48 hours. This map is easiest to understand when conditions are typical and hardest to read when unusual conditions exist; it takes knowing which patterns produce which weather. But you can see the shapes and patterns of larger rainstorms coming in very precisely without training. When it’s not rainy, keep an eye out for very low, thin clouds showing up as a moving veil of light over the ocean, and also for tiny patches of small storms. It takes some patience to review all the important details on this time loop that covers 4 hours in one-hour increments. There’s a clock at the bottom; time is shown in Greenwich and Eastern Time, not the Pacific Time Zone. Fun to see that the weather near Hawai’i comes out of the east, rather than what we get, which comes out of the west. Ah, the tropics.
Fogging Season
Use these two sites when it’s not rainy season.
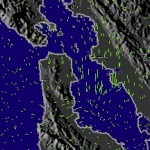 Wind: This animation gives you a sense for winds, but it’s not literal. (Line length represents wind strength, but a line crossing the Bay in 2 seconds doesn’t mean wind crossing the Bay in 2 seconds!) It’s useful for knowing wind direction, and if you get used to it, you can understand wind speed, too. (Hint: check the link for Modeled wind.) The animation is based on a few measurements well above ground level, and then interpolated using fancy formulae. This site is especially useful if you’re coming in from the warmer summer areas of the Bay region to do outdoor stuff (like Thinkwalks) in San Francisco. When the foggy winds blast, it feels as cold as winter around here. Some neighborhoods are spared the full brunt of it, as you can see in a typical animation. Our microclimates are due to hills blocking the airflow off the Pacific. Reduced wind always (in fogging season) translates to warmer weather—and a lot warmer if it’s sunny. Hilltops are windiest. Winds out of the east are often indicators of very polluted days in the city. In the winter, wind info is not as useful, though it can be fun seeing winds coming from the north, and north winds are generally colder.
 Visible fog: This one’s the same link as Visible clouds, up in the chance-o-rain section. By checking the extent of fog, along with how quickly it’s receding or advancing, it’s possible to make reasonable predictions for when and if your neighborhood will see the sun today. When using this one, make sure to read the description above, where it says Visible clouds.
Building our knowledge base together
If you have other sites that give excellent and very basic information for local SF weather prediction, or if you want to share other cool weather stuff, make a reply comment below. If I like it and think it’ll interest everyone, I’ll approve it to go up on the post. Otherwise, I’ll just reply to you through email.
I’ve had very good luck with Intellicast. All the weather sites are not pulling from the same predictions feed. For example, Intellicast’s predictions are noticeably different and better than the forecasts I get through Apple’s iPhone app. There is even some value in Intellicast’s 10-day forecasts. Around Monday or Tuesday I often start looking at that to plan the next weekend’s outings: http://www.intellicast.com/Local/Weather.aspx?location=USCA0987 Sometimes weather materializes or dematerializes or comes sooner or later than predicted. Sometimes it comes exactly as predicted, like this tomorrow’s warm spell, which they predicted a week ahead.